Mapping Information
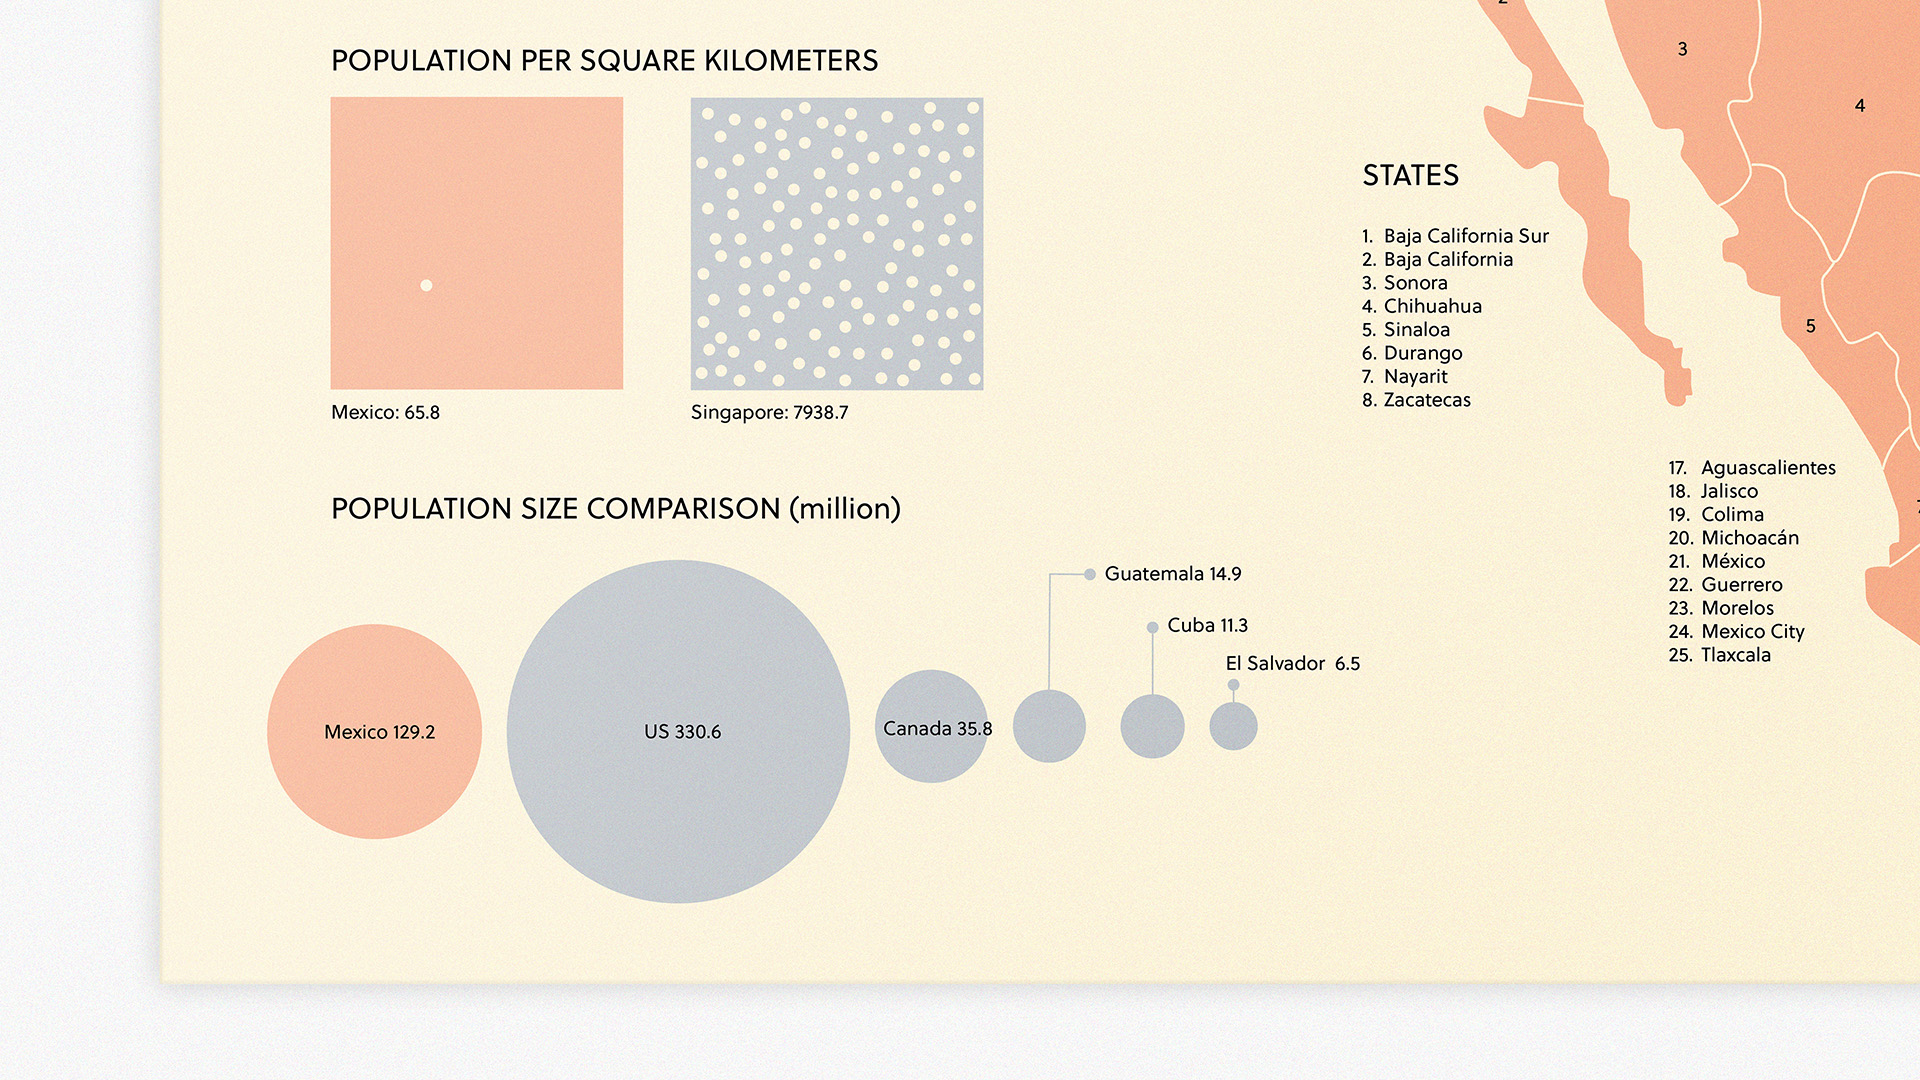
Standing at 60”x20”, the poster visualizes Mexico through 30 distinct data sets relating to economy, population, energy, health, and more. By drawing data from multiple sources (such as The Economist’s Pocket World in Figures, USDA, World Bank, and CIA), the country’s story is illustrated through a variety of graphics.